
- 5
- 0
- 0
9 400 RFDs from influence traffic: inside Makeberry’s Hungary case
Launching a new GEO usually means working across several channels at once: Facebook, PPC, SEO and other performance sources. But in the Makeberry Influence case, the approach was different.
The brand was looking for an opportunity to enter a new GEO, while the Makeberry team brought expertise in working with local audiences and influencers. Hungary was chosen as the market to develop through influence traffic, with Kick and Twitch streams as the main format.
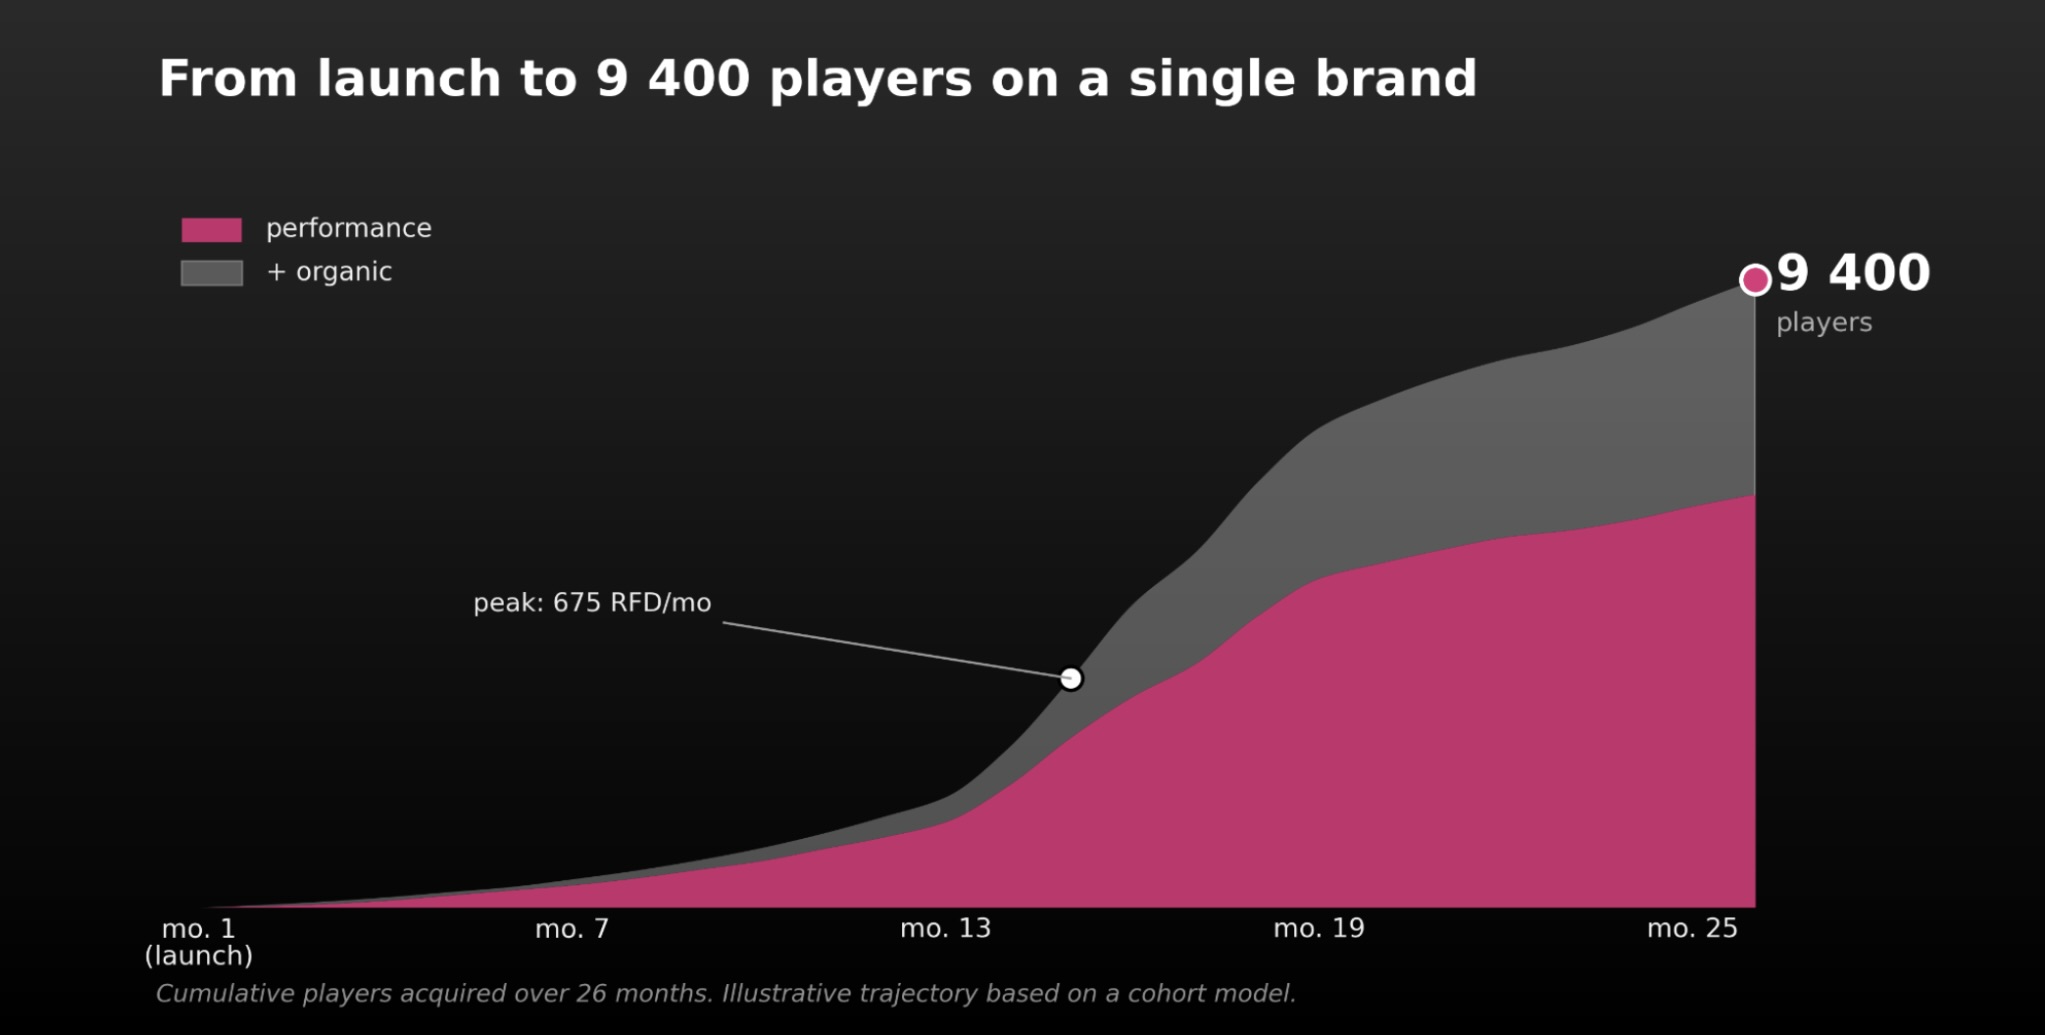
Over 26 months, the team went from the first tests with a budget of up to $30 000 per month to scaling with budgets reaching hundreds of thousands of dollars, working on retention traffic and achieving more than 24 000 registrations and 9 400 RFDs.
At a certain point, however, new traffic started losing quality, while its cost remained almost unchanged. This case explores which signals showed the decline in traffic quality, why scaling was stopped, and what insights can be applied to other campaigns.
Finding the right model
At the start, the team tested different influencers on smaller volumes. They looked not only at FTD numbers, but also at which partners brought players who returned after their first deposit and which audiences became the core of the cohorts driving the GEO into profit.
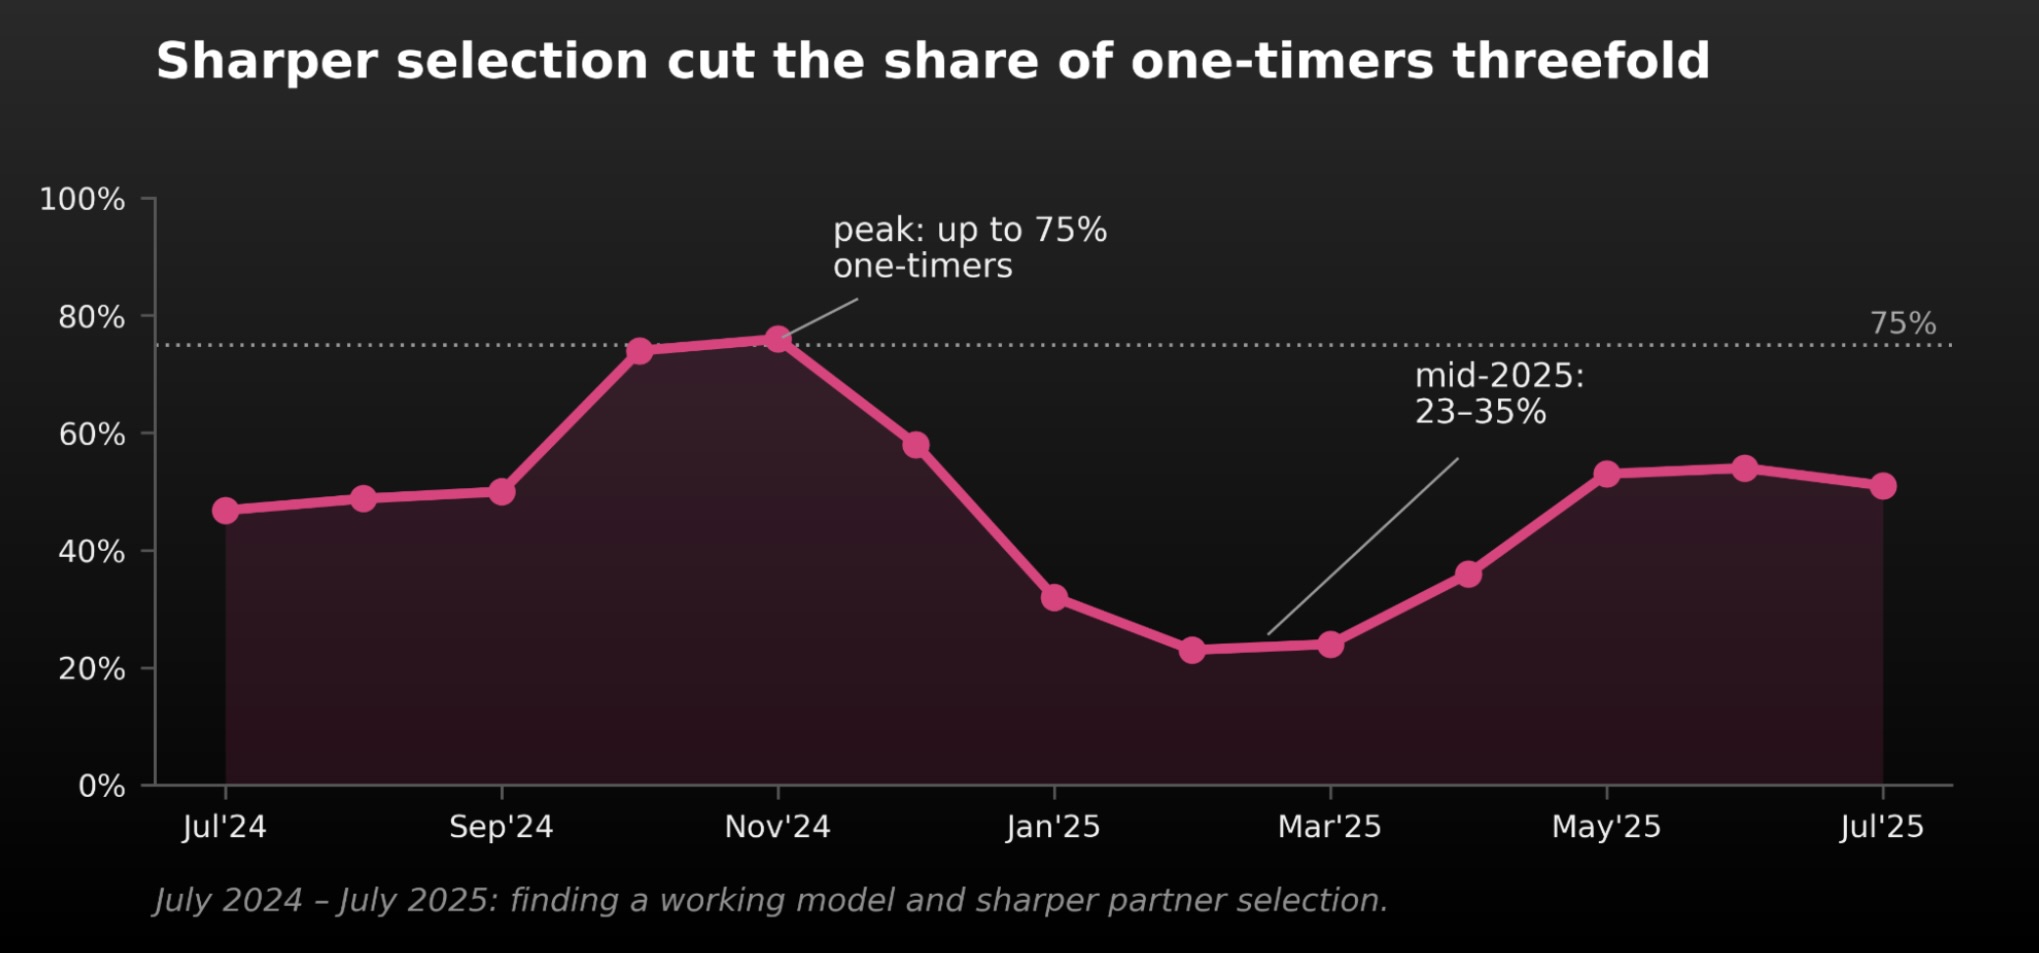
With some partners, the share of players who made only one deposit reached 75%.
Over time, the selection process became more precise, and the focus on this GEO increased. By mid-2025, the one-timer rate had dropped to 24–45% (depending on the month), while FTD volume reached 300 a month. The team then started scaling this model.
GEO scaling and results
From August 2025 to January 2026, the GEO reached 500–675 RFDs a month through direct performance. This was the strongest period for traffic quality and volume on this GEO for the brand.
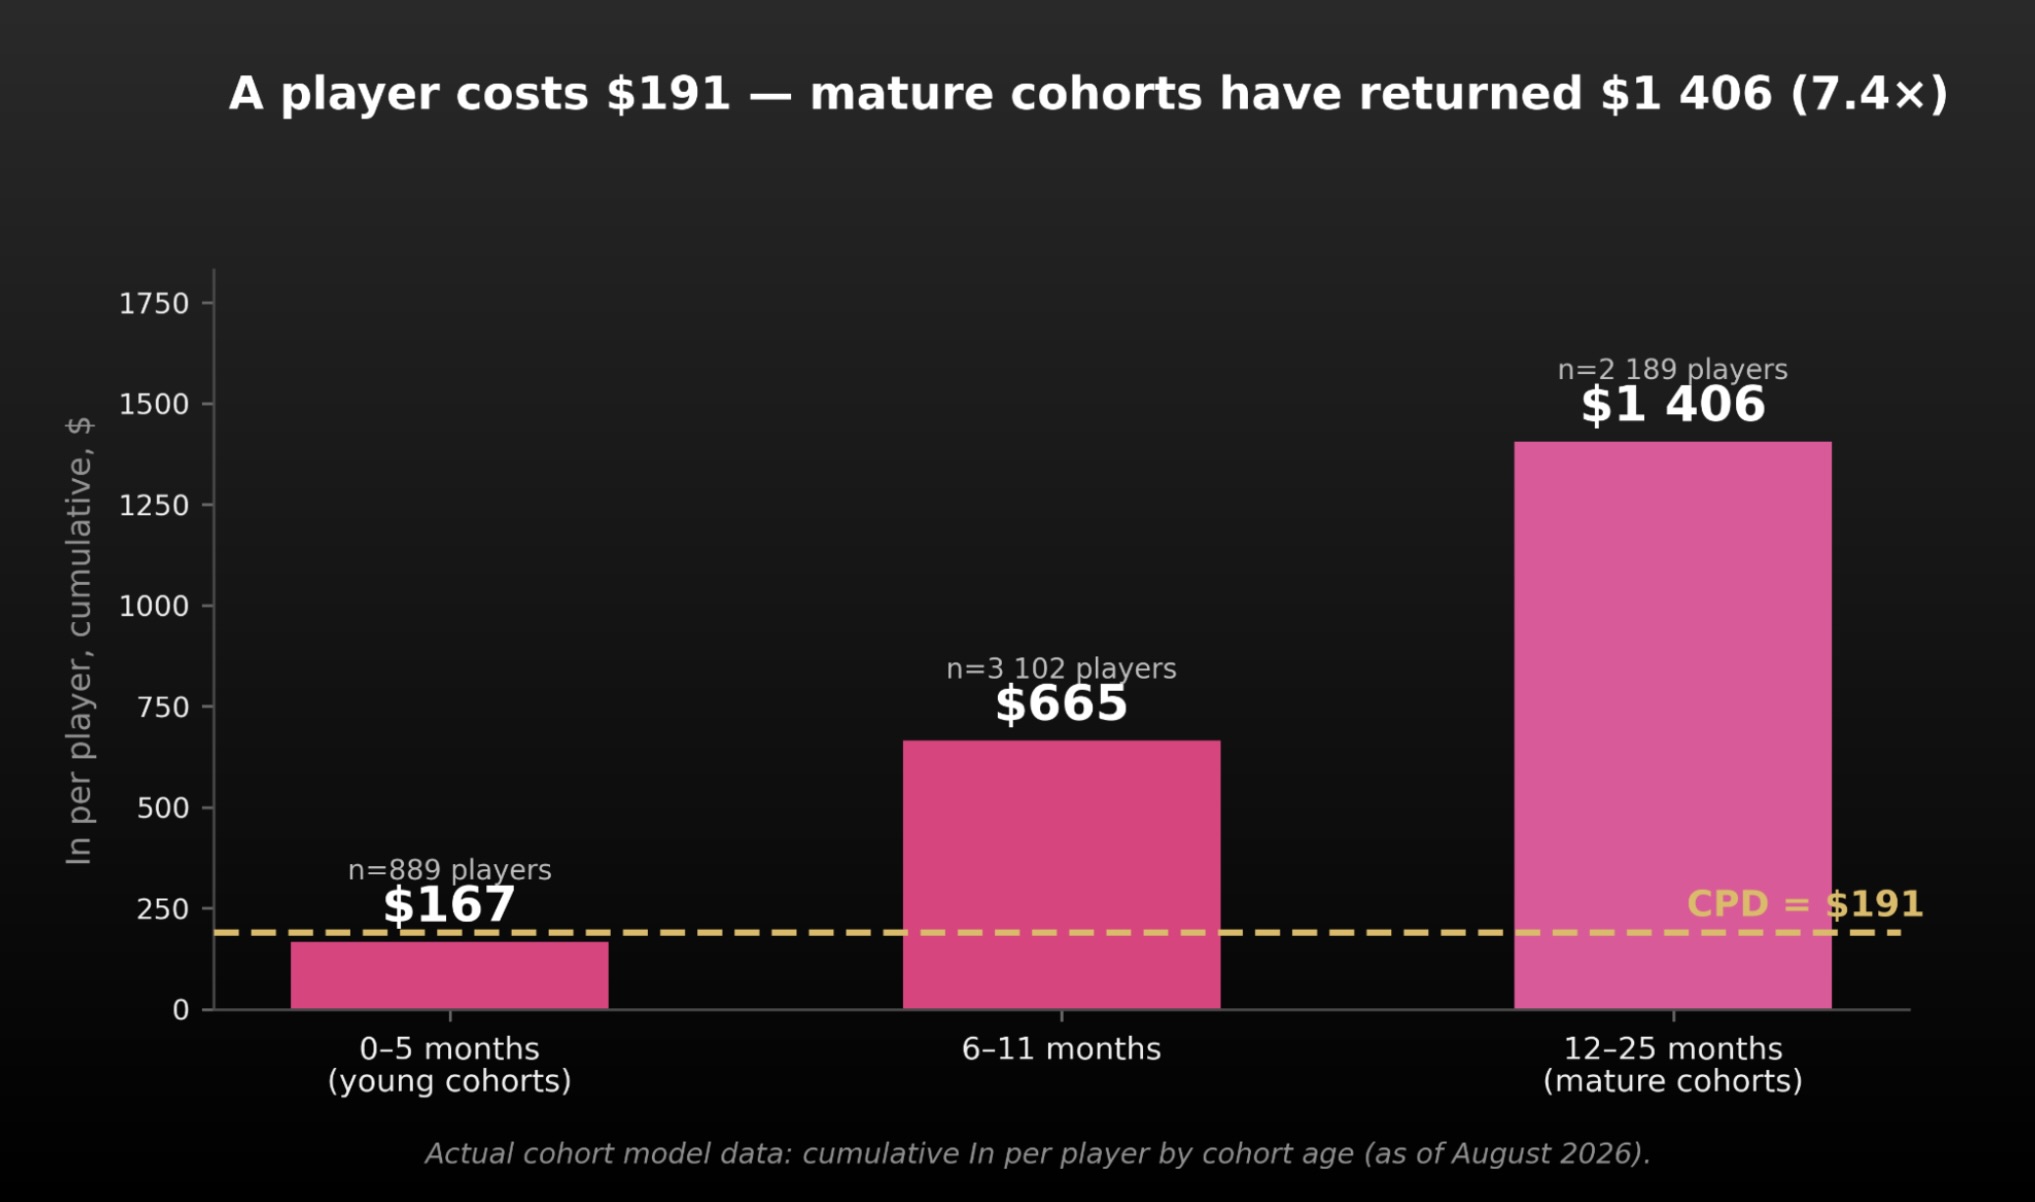
At the same time, the cost per player remained almost unchanged – around $190–220 through direct performance (meaning referral links – this distinction matters). This meant that tripling the volume did not lead to a proportional increase in traffic costs.
The cost per player was relatively high for a Tier 2 GEO. At the time, competitors were targeting $120–150 per player.
However, Makeberry Influence’s strategy was built around investing more to reach the most active gambling audience in the country through the biggest streamers and offering better conditions within the brand. Here is how this affected player quality based on average cohort values across different ages:
Below is the graph showing volume and cost per deposit. The most cost-efficient traffic came from larger volumes with top streamers – the hypothesis was confirmed: influence traffic delivers stronger results at scale.
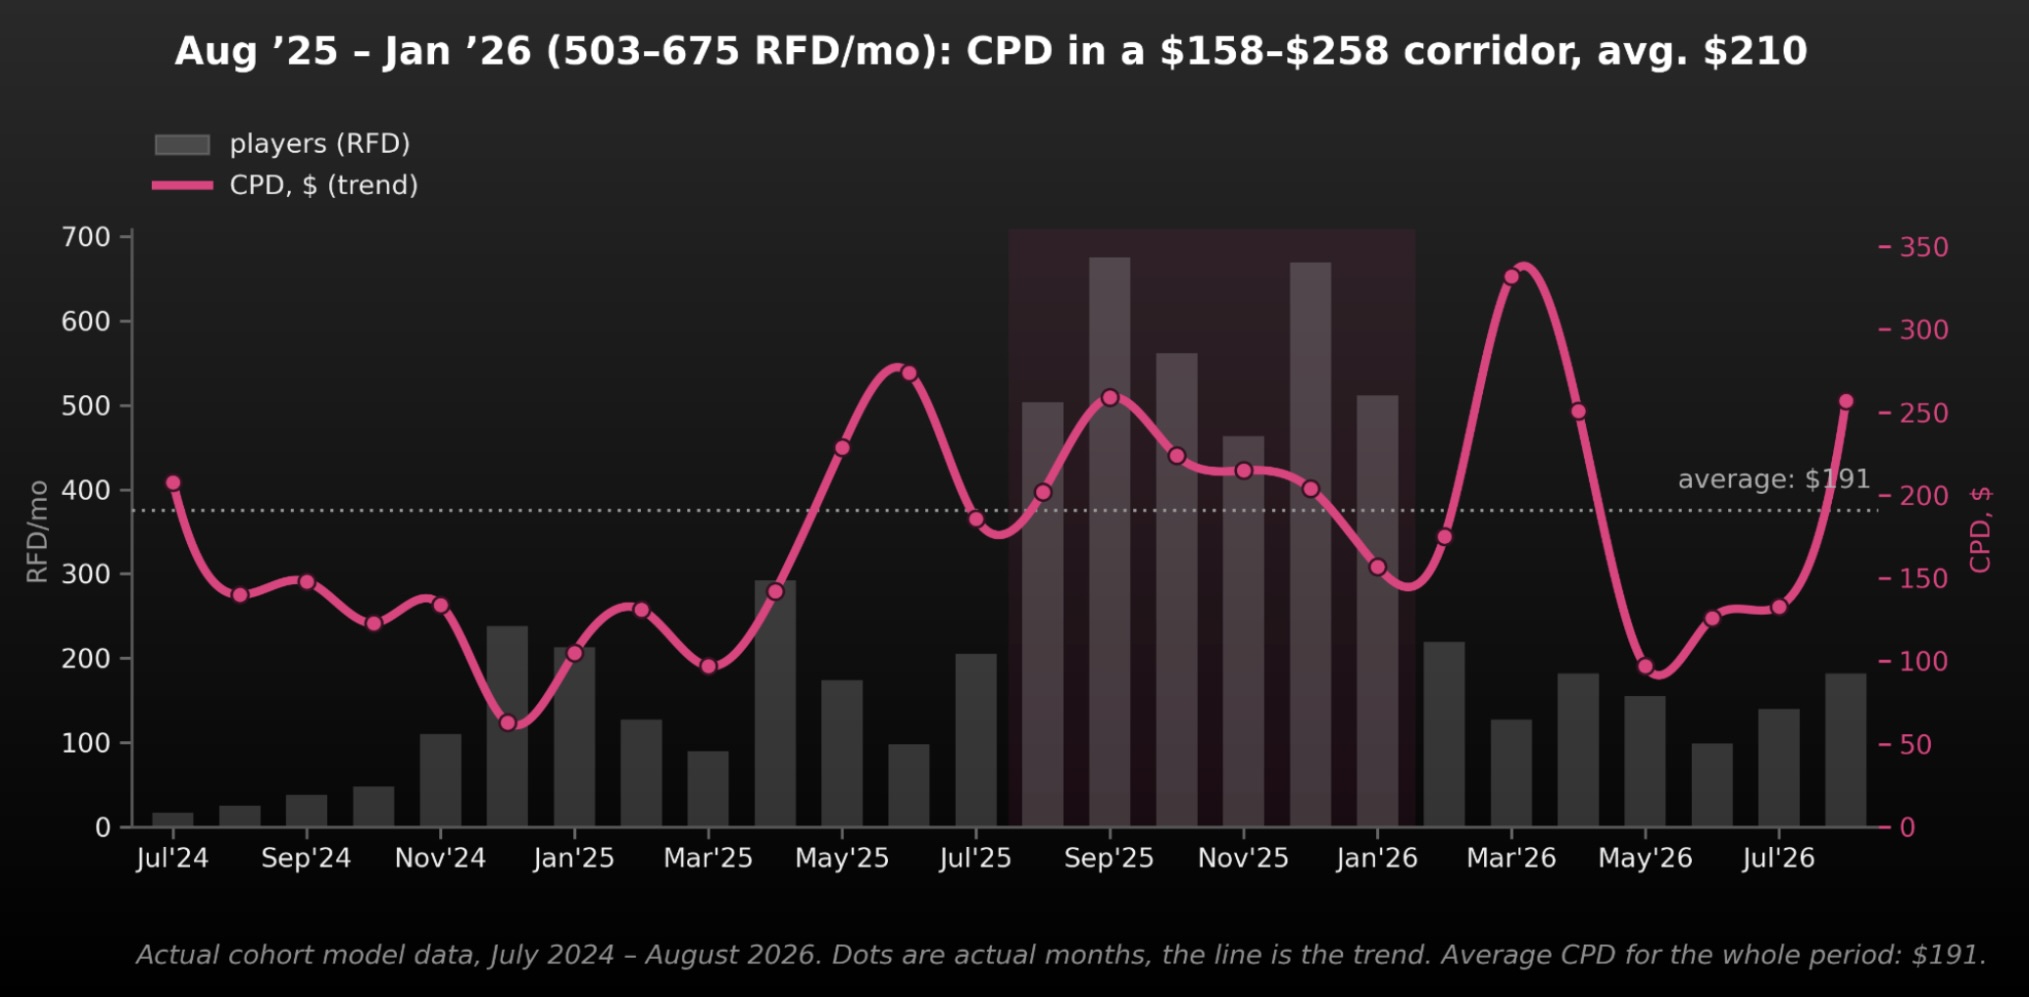
The impact of brand awareness from these partnerships will be covered next. Makeberry Influence was among the first teams in the market to fully quantify and understand the real impact of influence traffic.
Performance traffic started losing quality and volume
After reaching a peak of 500–675 RFDs a month, both CPD and RFD volume started to decline. At the same time, the one-timer rate rose above 70% and remained at that level even when CPD dropped to $96. What was the reason behind this?
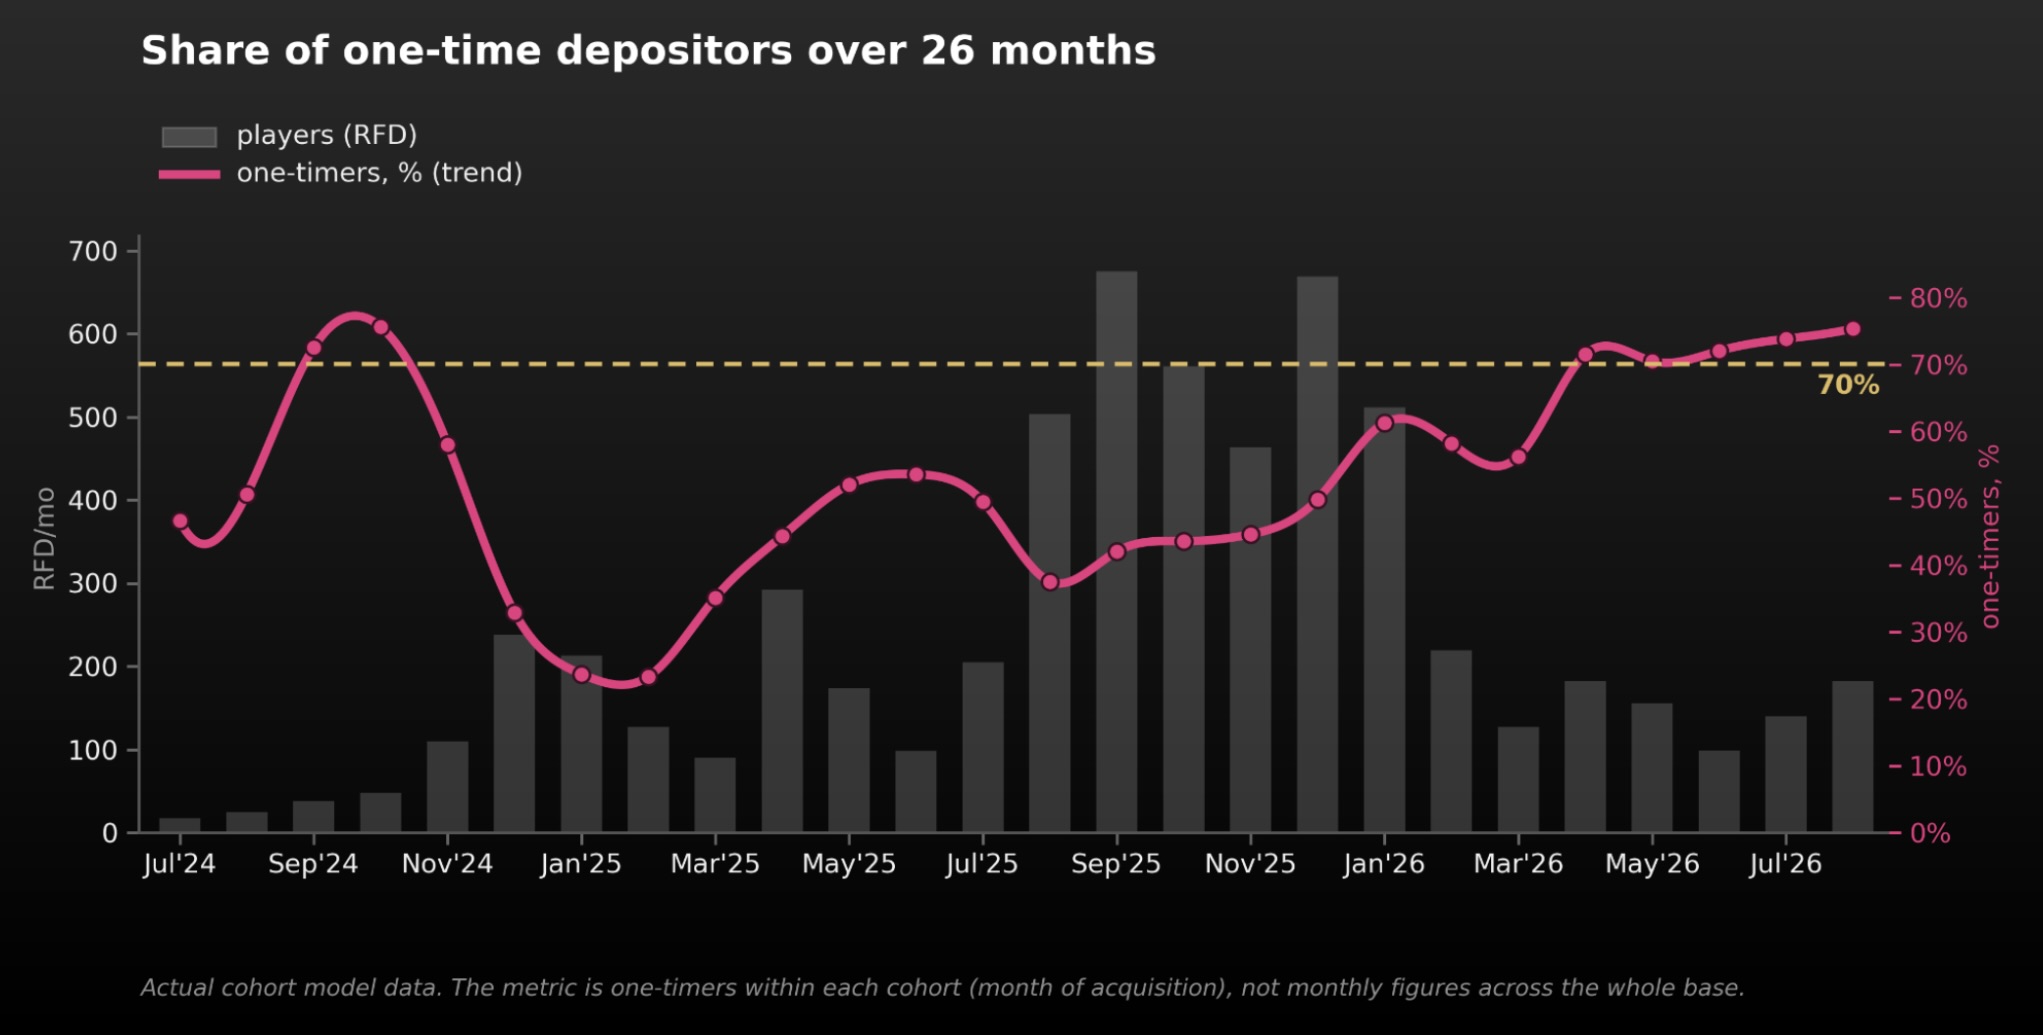
The graph shows how the one-timer rate differed in new traffic during the scaling stage, as well as before and after the main volume push and the launch of all advertising campaigns. It is important to note that this is a cohort-based metric for each month – meaning the one-timer rate for the cohort acquired in a specific month, not monthly traffic statistics.
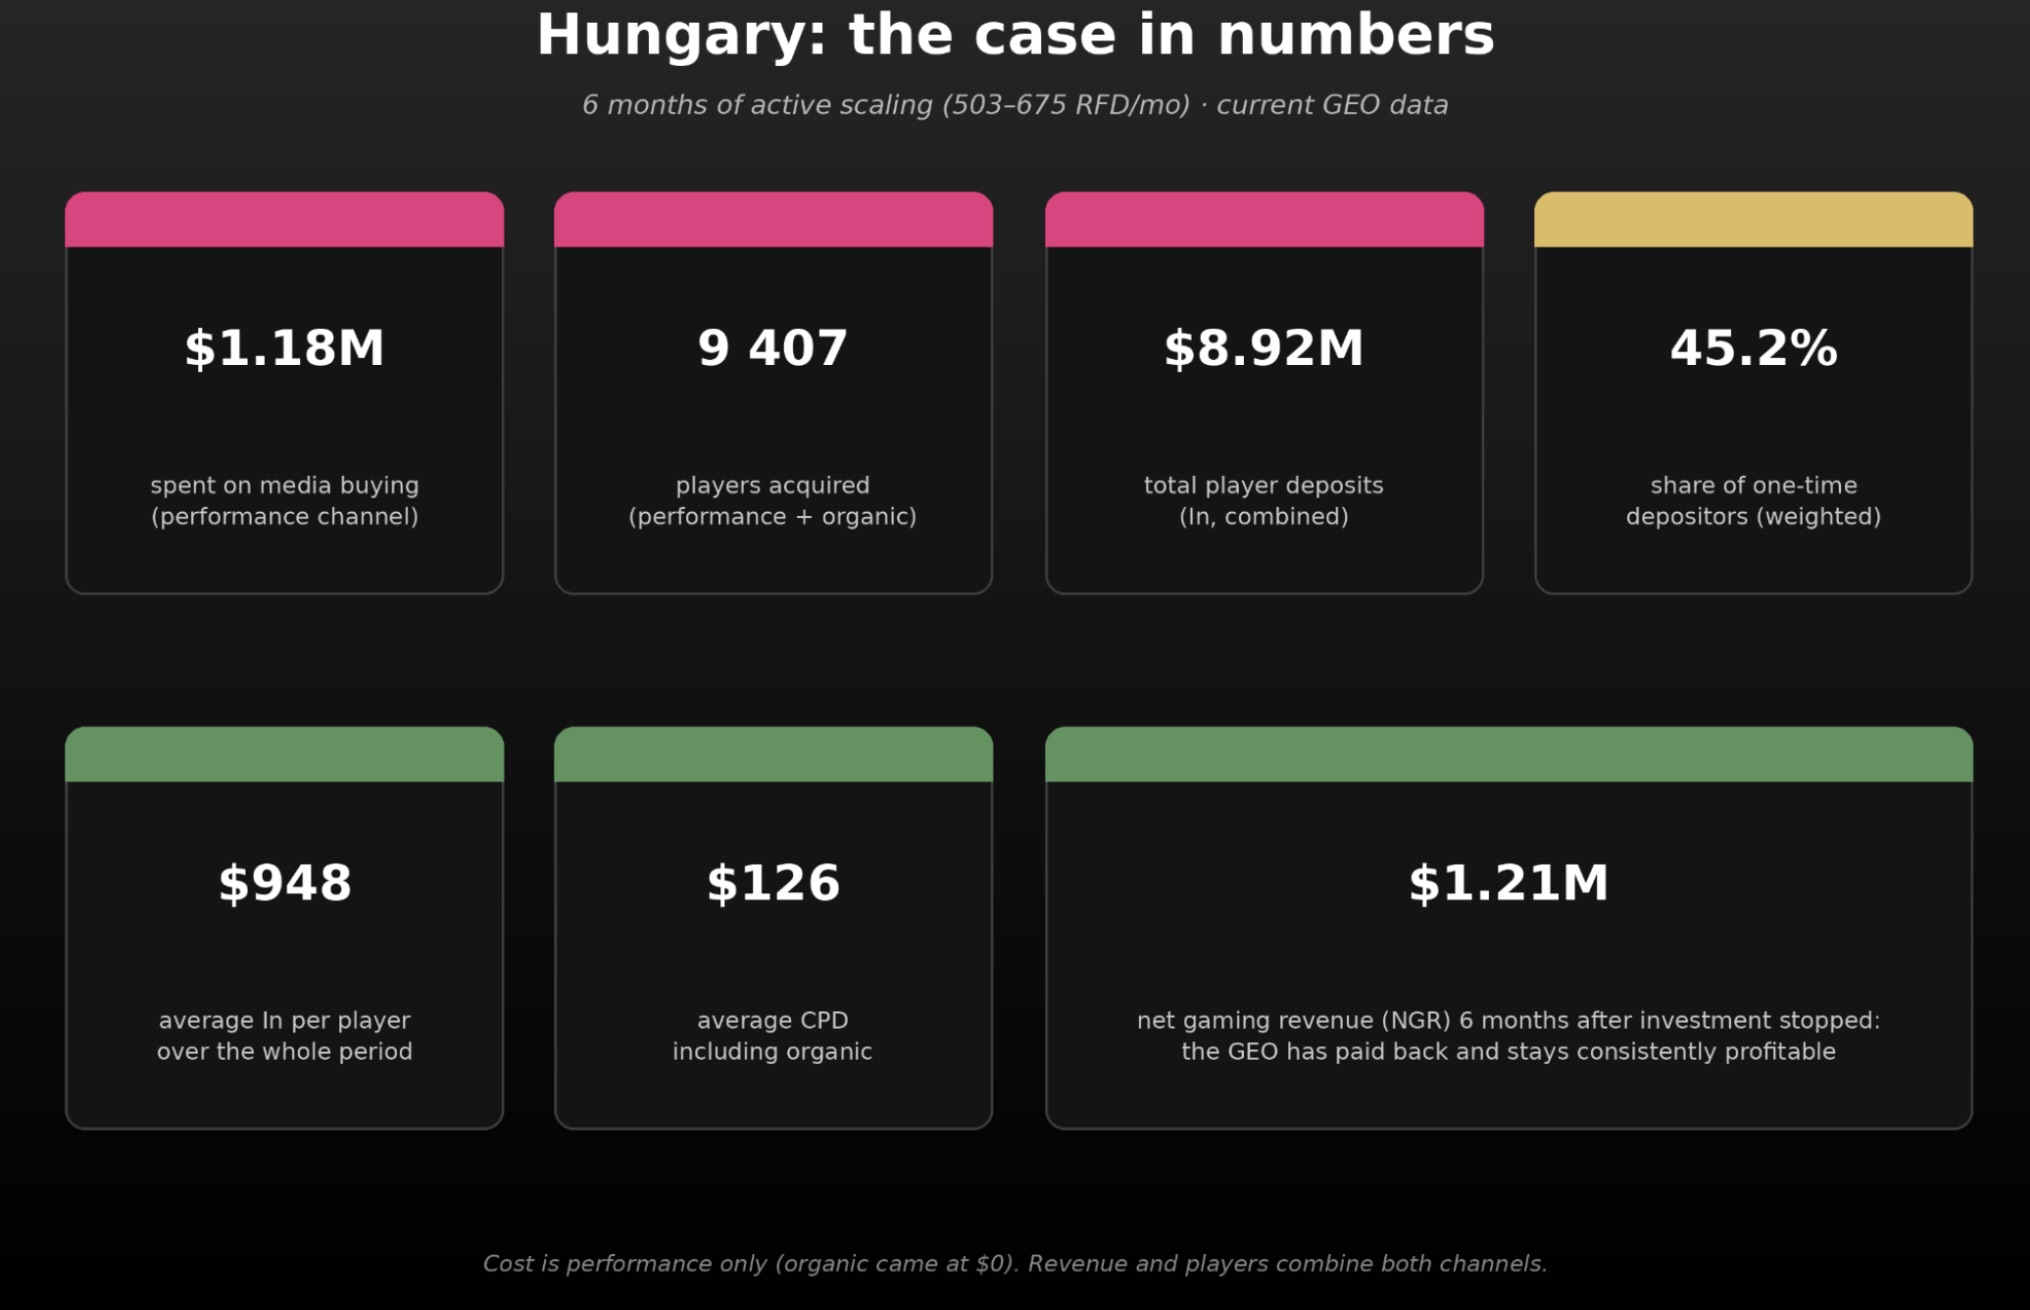
By January 2026, the team had already worked with all top influencers. Given the relatively small size of the GEO, covering the main pool of streamers required slightly more than $1 000 000 in spend (more on this later).
A significant share of the audience was already familiar with the brand, and performance increasingly worked not on acquiring new players, but on maintaining activity within the existing base and its core of loyal players. Traffic became cheaper, but new cohorts became significantly weaker. The next stage began.
What is brand awareness really and how can it be measured?
The rise in one-timers pointed to a problem with new traffic. But did it mean that the GEO had reached its full potential?
At this point, the impact of brand awareness was not included in the calculations, as it is difficult to measure directly. It is usually evaluated through views, reach and clicks. These metrics require significant effort and budgets, but they don’t always show exactly how a brand influences future user behaviour.
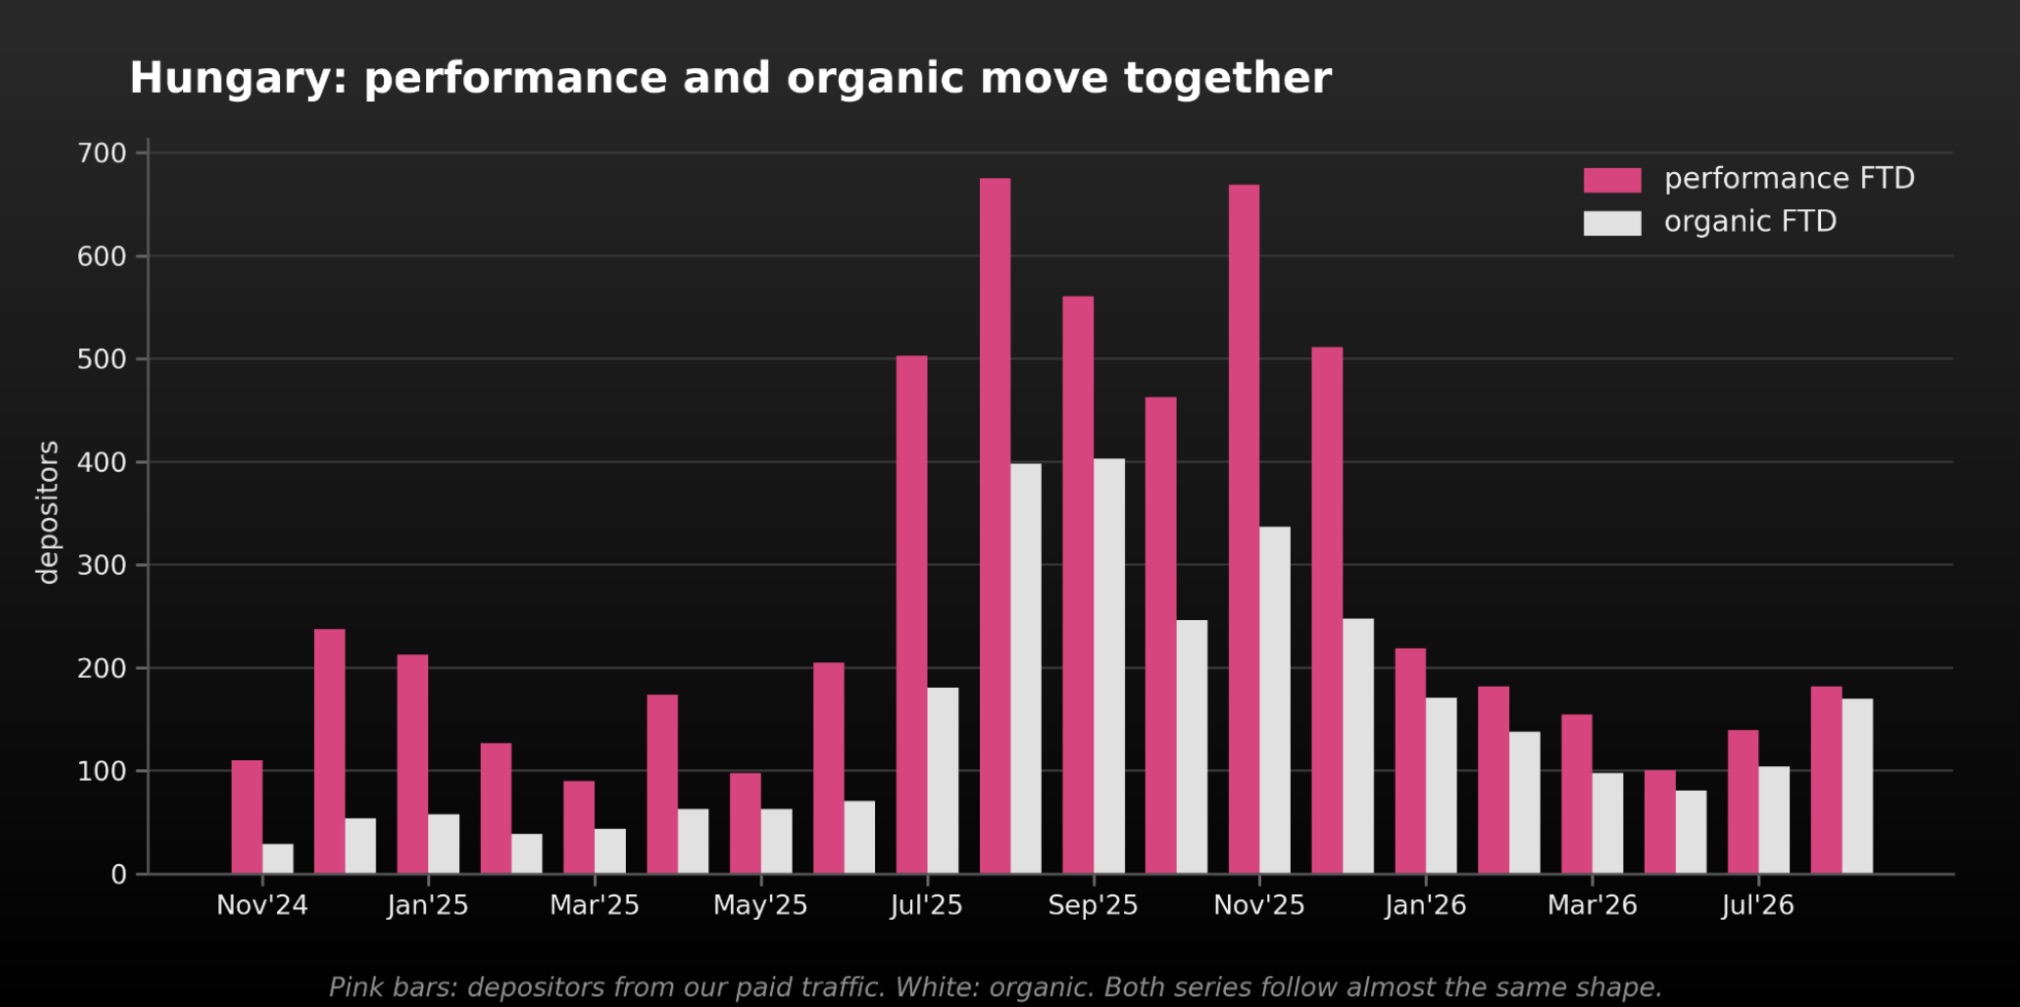
So what impact did brand awareness have in this case? The graph shows two groups of sources: the pink lines represent traffic from influencer referral links (direct performance), while the white lines represent Direct and SEO traffic for the same months. The graph shows a correlation between changes in these sources during periods of active scaling and reduced volumes.
In Hungary, no other acquisition sources were running for this brand, allowing Makeberry Influence to separately assess the impact of influence: some users did not come through referral links but discovered the brand after several touchpoints – searching for it on Google or visiting the brand directly.
That is why influence should be considered together with SEO and PR: these channels can strengthen each other’s results. We will cover the impact this had on GEO economics next.
How organic traffic brought the GEO into profit and why the team stopped buying traffic
Some users did not use referral links and instead returned to the brand through SEO or Direct. This is common for influence traffic, but many brands don’t account for this user behaviour when evaluating results. Here is how the difference between brand-driven and performance traffic changed over different periods:
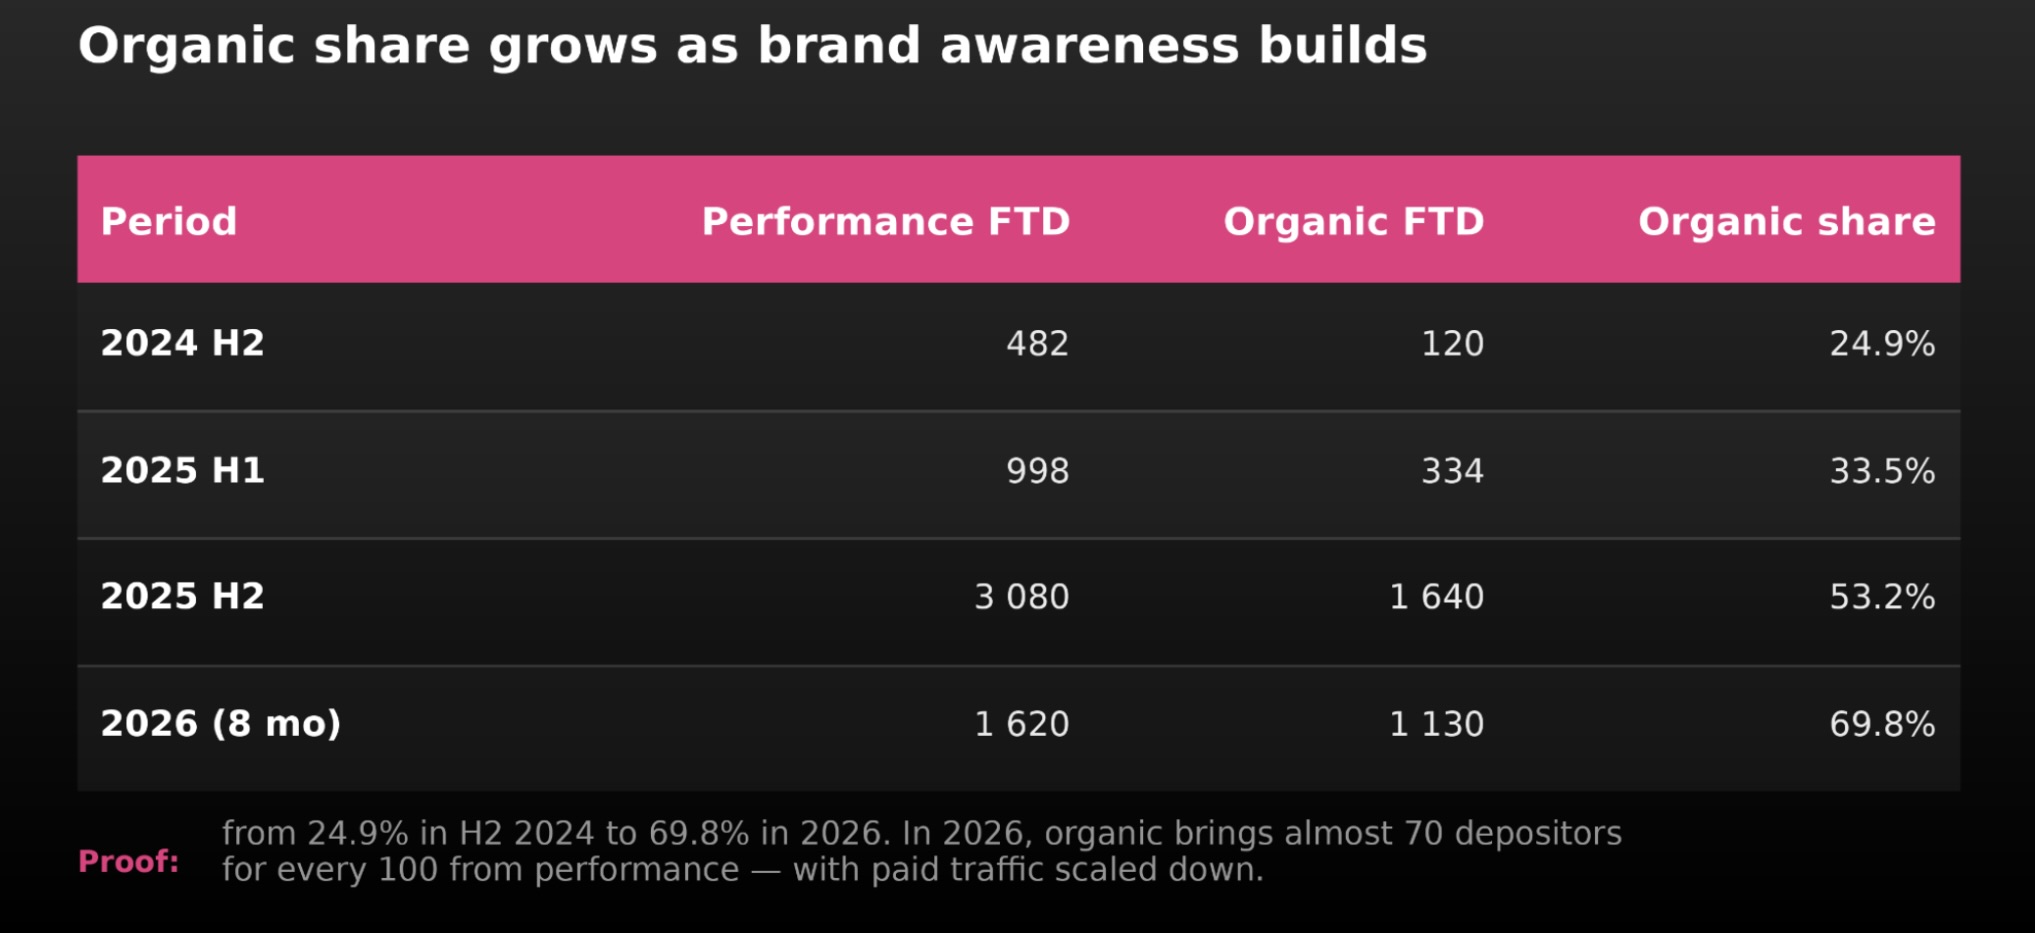
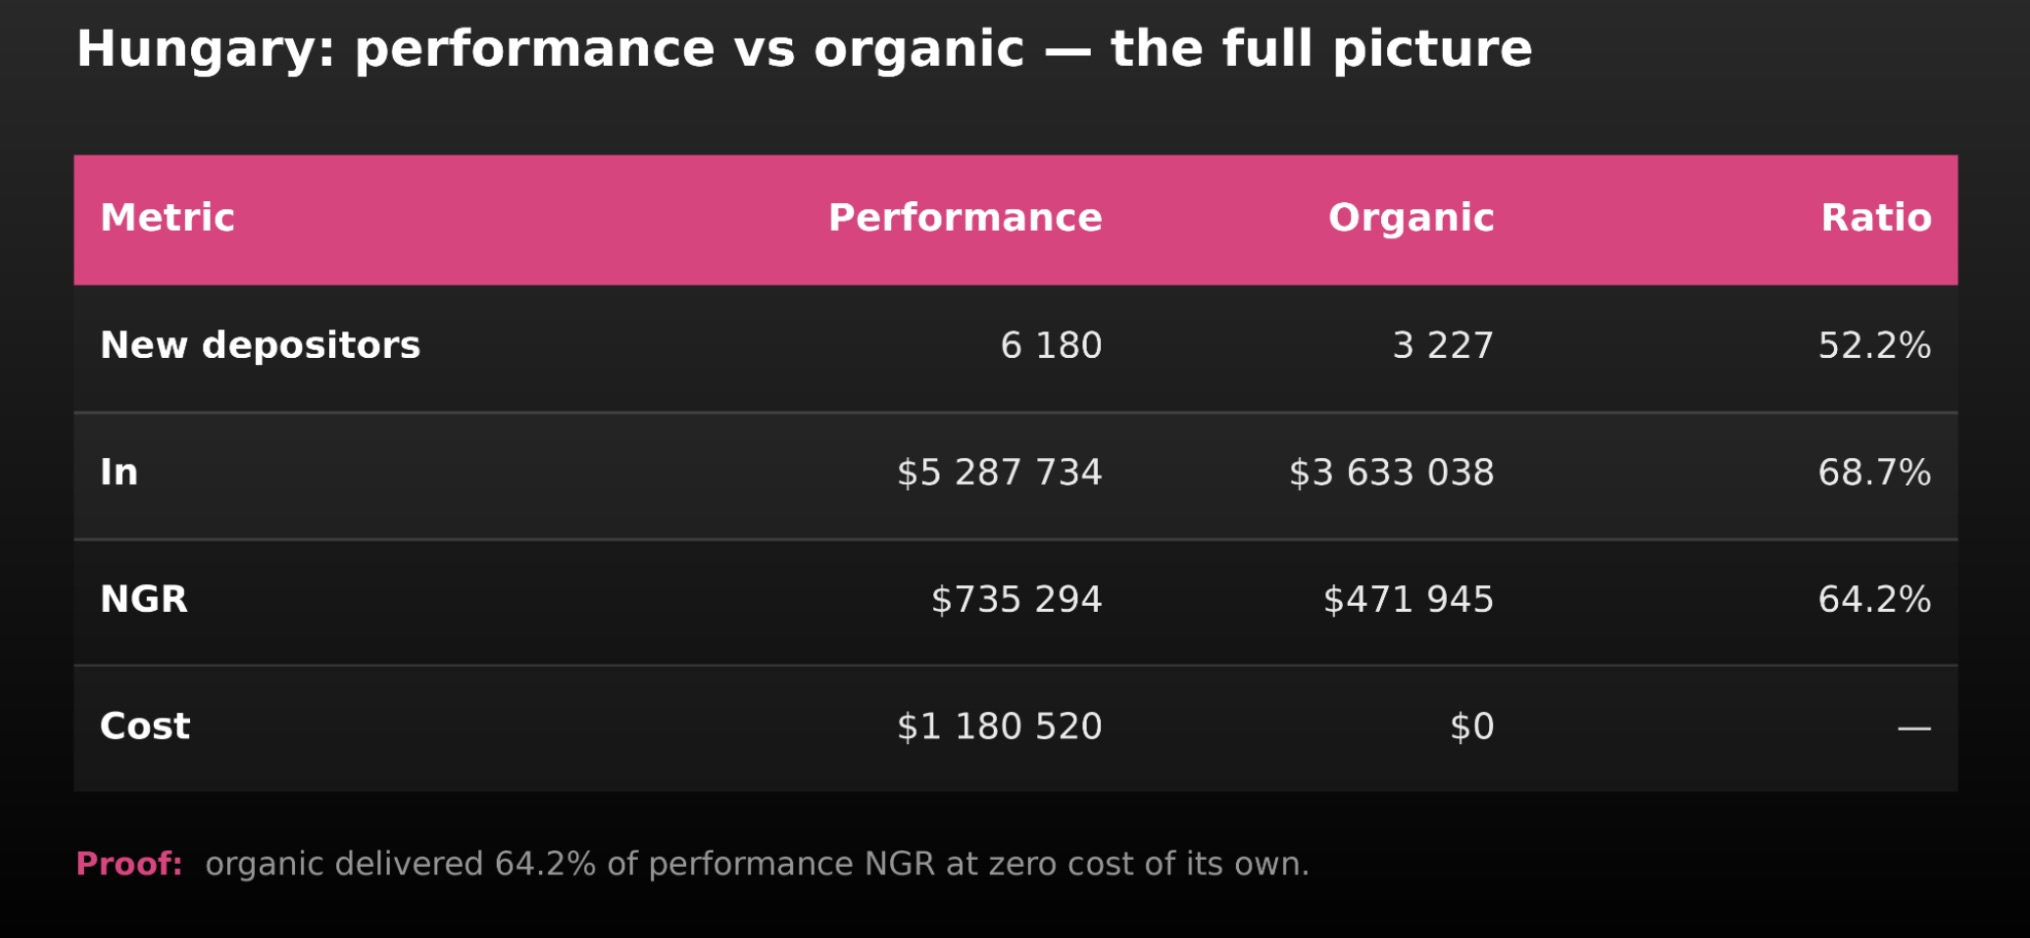
The share of organic traffic grew from 25% to almost 70% when significant investments stopped, showing the accumulated effect of brand-building efforts.
From March to June 2026, the team deliberately stopped actively acquiring new traffic. Instead of trying to push the GEO further with additional budget, they decided to see what would happen with the existing base, taking source fatigue into account.
Without a separate budget, organic traffic brought +52.2% of users and $472K in NGR. This traffic came with almost no additional spend, which helped bring Hungary into profit faster than planned and effectively recover the investment.
It is worth noting that the expected payback period and KPIs for each cohort separately (including the newest ones) were set at up to 8 months. For influence traffic, this was considered a normal timeframe for evaluating direct performance, while many teams working with Facebook and other sources focus on shorter payback periods of 2–4 months. In this case, the additional effect of brand awareness and organic traffic helped achieve results faster than direct performance alone would have shown.
Hungary is now approved as one of the brand’s priority GEOs. Other sources are starting to work with it; the brand has been localised in Hungarian, and the scaling strategy has been confirmed.
What this case brought to future GEOs and how to apply these insights to your own campaigns
The Hungary case gave Makeberry Influence more than just another successful case – it provided a working model for launching new GEOs: how to find the right partners, test funnels, evaluate traffic quality and identify when the pool of quality traffic starts to shrink. This experience has already been applied to larger Tier 1 GEOs and other sources, but more on that in future materials.
How to vet influencers before launch, choose the right GEO and platform, assess audience quality, spot fraud and evaluate campaign economics – all of this is covered in the full influence guide.
It includes real benchmarks and Makeberry Influence’s experience working with Tier 1 and Tier 2 GEOs.
Get the guide for free by filling in this Google Form.

- 5
- 0
- 0
- By rating
- In order